Introduction
As a prominent technical analysis tool, the Inside Bar Candle Breakout reveals important information about possible market movements. For traders looking for breakout, reversal, or continuation signals, this pattern—an Inside Bar—is significant. It consists of a smaller candle inside the high and low range of the preceding Mother Bar. The inside bar pattern represents moments of market hesitation before big price swings, therefore understanding its subtleties is vital for making informed judgments in stock trading. Because of the ever-changing nature of the financial markets, traders must delve deeply into the Inside Bar candlestick breakout technique if they want to succeed.
A Brief Explanation Of Inner Bar Trading
In commodities, stocks, and currencies, inside bar trading is a typical technique for technical analysis. The Inside Bar pattern, which consists of two candlesticks—the Inside Bar and the Mother Bar—is essential for identifying potential changes in market direction. An inside bar forms when the previous candle engulfs the high and low of the inside bar, creating a range in price action. It is common practice to place the candlestick with the larger range, known as the Mother Bar, before the Inside Bar.
The Significance Of Spotting Possible Signals Of A Breakthrough, Reversal, Or Continuance
Inside bar trading’s main benefit is the information it may give about potential changes in market dynamics. In order to predict if the market will turn around, break out, or remain stable, traders keep an eye out for this pattern. Having a good grasp of these signals is essential for making informed trading decisions and effectively managing risk. For markets that are showing indications of consolidation, such an inside bar, a price breakout from this range could indicate the beginning or continuance of a new trend.
Reversal Indicators
The Inside Bar could signal a change in the market’s trajectory in specific contexts. This shift in fortunes could be due to a small correction or a large trend reversal.
Trend Indicators
The Inside Bar pattern has the potential to reveal upcoming trends in specific contexts. Indicators inside the pattern and its surroundings help traders determine the expected durability of the present trend.
The Inside Bar Pattern’s Mother Bar And Inside Bar Elements
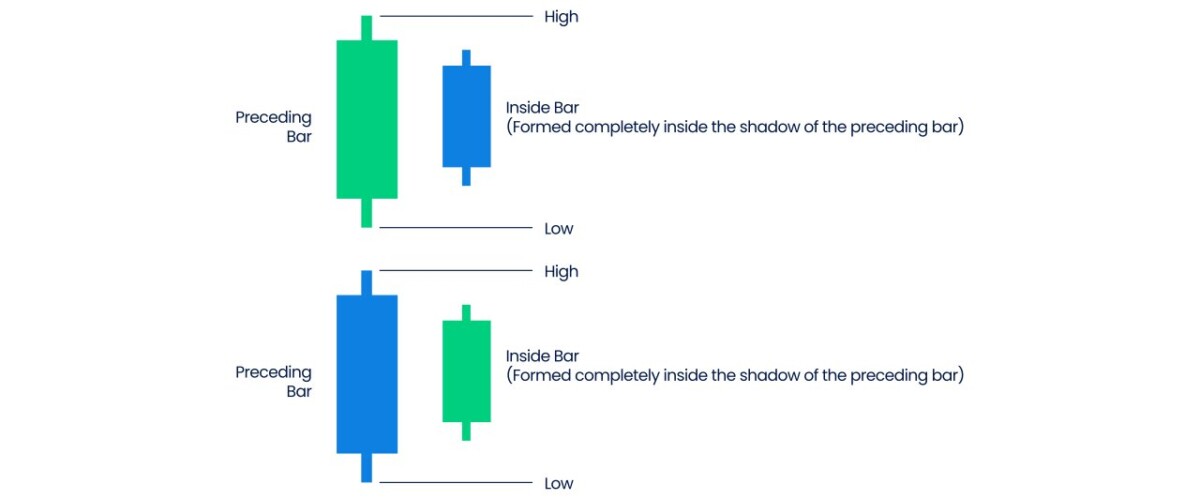
Candlesticks that do not extend past the range of the preceding mother bar are called inner bars. The market is in a period of consolidation or indecision at the moment. An inside bar is preceded by a candlestick known as the mother bar. It typically has a broader range and sets the stage for the potential breakout, reversal, or continuation suggested by the Inside Bar. Understanding the relationship between the Inside Bar and the Mother Bar is crucial for accurate pattern analysis. Traders can predict future price variations by looking at the size, color, and positioning of the Inside Bar relative to the Mother Bar.
Inside Bar Pattern Varieties
The Bearish Inside Bar
If the Mother Bar consists of a long red candlestick that is bearish and then a shorter green candlestick that is bullish, then the market is likely to experience a bearish inside bar.The previous Mother Bar’s high and low range engulfs the Inside Bar entirely. This indicates that the market is currently consolidating following a strong negative move, which could indicate hesitation or a possible turnaround.
Importance In Maintaining A Bearish Trend Or Turning Bullish
The formation of a bearish continuation pattern is defined as the occurrence of a bearish inside bar amid a strong downturn. Traders see it as a temporary consolidation period before the current downward trend picks up again. During Potential Bullish Reversal the Bearish Inside Bar could indicate a possible bullish reversal in some settings, such as when a short green candlestick comes after a long sequence of red candlesticks. This might mean that traders are starting to think about taking long positions, since market sentiment is turning bullish.
An Upside-Down Interbar
What we call a “Bullish Inside Bar” happens when a long green candlestick—the Mother Bar—follows a shorter red candlestick—the Father Bar—in a bearish trend. The Inside Bar, like the Bearish Inside Bar before it, is completely contained inside the range of the previous Mother Bar’s high and low values. Following a strong upswing, the market may experience a period of consolidation or uncertainty.
Importance Of A Bullish Reversal Or Continuation
A Bullish Inside Bar, when placed within the context of an ongoing uptrend, indicates a temporary consolidation period before to the uptrend’s continuation. A long opportunity may present itself if traders see it as a continuation pattern. Bearish Reversal: The Bullish Inside Bar can indicate a possible bullish trend reversal if a brief red candlestick arrives following an extended string of green candlesticks. Investors may see this as a signal to start selling, as they are hoping for a change in market mood from positive to negative.
Recognizing Inside Bar
Find The Current Trend By Analyzing Price Movement Or Technical Indicators
The first and most important step in learning to read Inside Bar patterns is to pinpoint the current trend. Two common methodologies that traders often use to detect the current trend are:
Key Performance Measures
To determine the future course of the market, traders could look at technical indicators like momentum oscillators, trendlines, or moving averages. For instance, moving averages can show the direction of a trend and assist level out price swings.
Analysis Of Price Movements
Examining the real price movements on the chart, without depending on indicators, is what price action analysis is all about. Patterns, levels of support and resistance, and trendlines are the tools traders use to determine the future course of the market. The formation of an Inside Bar can be better understood if one is familiar with the fundamental price action patterns that indicate reversal or continuation. Before traders can evaluate the possible consequences of an Inside Bar, they need to know if the market is in an uptrend, downtrend, or sideways trend.
Find The Inside Bar Engulfed By The High And Low Of The Previous Candle
The trader next searches for the telltale signs of an Inside Bar after the trend has been established. These conditions characterize the Inside Bar:
Size
A narrower range than the Mother Bar that came before it should characterize the Inside Bar. This portends a time of market consolidation or uncertainty as volatility decreases.
Loss Of Consciousness
The previous Mother Bar’s highs and lows must entirely swallow the Inside Bar’s highs and lows. As a result, the smaller candlestick will appear to be “inside” the range of the bigger one.
Primary color
Though it’s not crucial, the Inside Bar’s color might offer another layer of complexity to the interpretation. If we see a short green candlestick inside a longer red one, we know it’s a bearish inside bar. You can tell it’s a bullish inside bar when you see a shorter reddish candlestick inside an extended green one. To verify the existence of an Inside Bar, traders can visually recognize it on a price chart by looking for these indicators. This pattern indicates a time of market consolidation or hesitation, which could be followed by breakout, reversal, or continuation signals depending on the price action that follows.
Signature Features Of Inside Bar Strategies
Traders that employ the Inside Bar strategy give serious thought to a number of distinguishing features.
Considerations Regarding The Time Frame
The effectiveness of the Inside Bar pattern is highly dependent on the time range employed for analysis. Everyone agrees that regular usage brings out the best in the Inside Bar design. A daily time frame is ideal for analyzing market mood since it smooths out price movements and removes noise from shorter time frames. The signals may be less reliable owing to greater market noise, but shorter time frames may produce Inside Bars more often. On the flip side, if you use a longer time frame, you could not get as many indications and miss out on some opportunities. In order to find the sweet spot between signal frequency and signal accuracy, traders typically use the daily time frame for best Inside Bar analysis.
Requirements For Market Trends
When there is a strong market trend, the Inside Bar pattern can be quite effective. The Inside Bar signals are more reliable when the trend is strong and clear. In order to determine whether the Inside Bar represents a possible continuation or reversal signal, it is required to consider the prevailing trend. The pattern indicates a temporary consolidation before the trend restarts in trending markets, giving traders attractive entry points. When there is no obvious trend in the market and prices are moving laterally or ranging, Inside Bars might not be able to produce convincing indications. Consequently, traders seldom rely on Inside Bar formations until they have identified well-established patterns.
Difference Between Mother And Inside Bar Sizes
While evaluating the strength of the signal, it is crucial to take into account the size relationship between the preceding Mother Bar and the Inside Bar. A perfect world would have the Inside Bar’s range being less than the Mother Bar’s. This substantial shrinkage heralds a period of diminished volatility and market uncertainty. A possible breakout could occur if market participants are momentarily puzzled about the direction, as suggested by a bigger Mother Bar and a smaller Inside Bar. When an Inside Bar appears in either the top or bottom portion of the Mother Bar, many traders pay attention to it. Traders’ apparent increased confidence in the price’s future trajectory may explain this posture.
Scenarios For The Breakout In The Current Trend Following The Price Breakout
When using the Inside Bar technique, it is important to keep in mind that breakouts following the pattern are a major aspect. The creation of an inside bar right after a price breakout in the current trend is a very reliable indicator. The current trend is probably coming to an end, and the market is about to reverse, according to this sequence. By executing long orders during a slump or short orders during an uptrend, traders can take advantage of these conditions. Traders might tactically position themselves for a major price movement in anticipation of the expected reversal, which is preceded by the inside bar.
The Inside Bar Candlestick Pattern And How To Trade It
Identifying The Range Of Bar Consolidation Markings
Traders need to identify the Inside Bar’s consolidation range before they can successfully trade the pattern. The first step is to locate the inside bar’s high and low points on the price chart. By joining these levels, the consolidation range is produced, which visually represents the market’s indecision or temporary equilibrium during the construction of the Inside Bar. Identifying this range is crucial for trading strategies and making educated judgments on entry, stop-loss, and take-profit levels.
Trading Strategies
Starting A Trade Using An Inside Bar
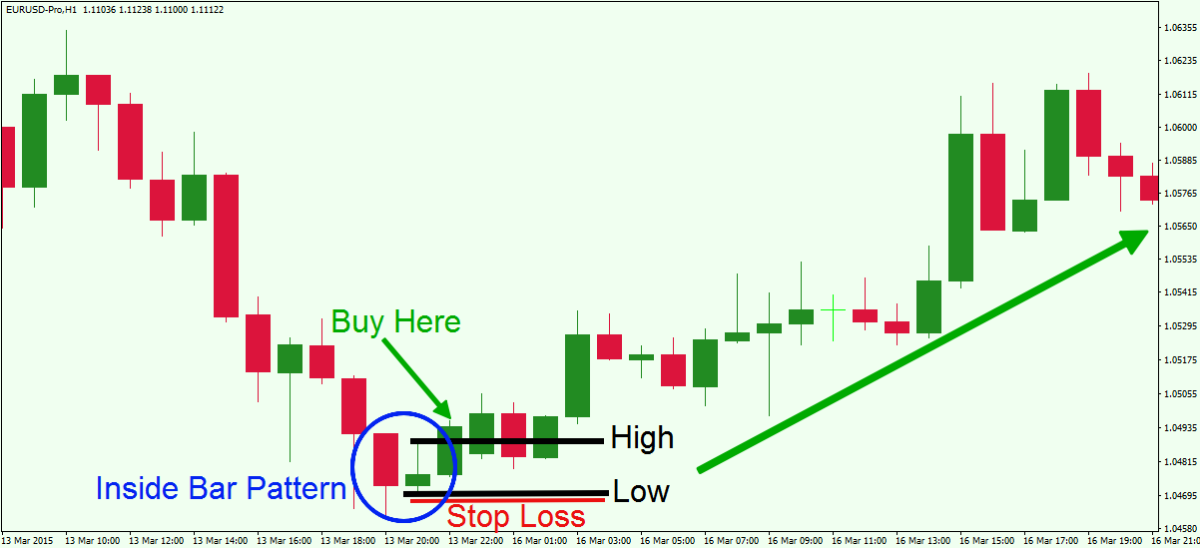
Once price movement on a chart completes an Inside Bar, traders will mark the top and low of the consolidation range that forms an Inside Bar. You can use these levels as a starting point for possible trades:
Bullish Breakout
A long position might be considered by traders if the price action surpasses the upper level of the Inside Bar range. This could indicate that the uptrend may be continuing.
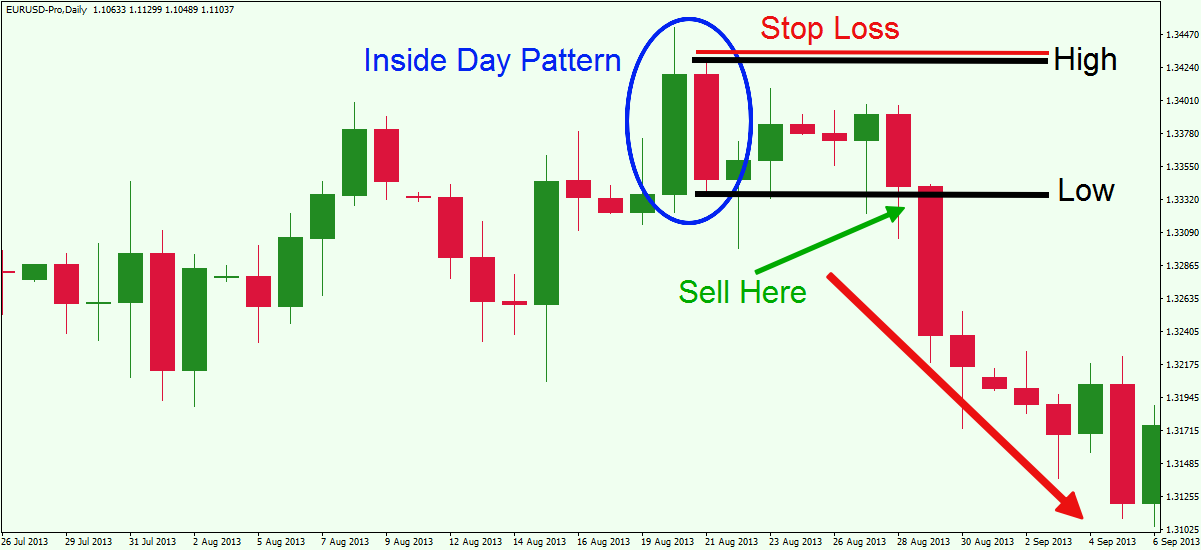
Bearish Breakout
The inverse is also true: traders may think about going short if prices drop below the range’s lower level. This could be a sign that the bearish trend will continue. There are two main entrance strategies that traders might employ: conservative and aggressive. The price movement must settle above or below the Inside Bar range for conservative traders to participate, providing confirmation; aggressive traders may enter as soon as the price breaches the range.
Trading With Stop Loss Inside Bars
You must use a stop-loss order to control risk while trading with any pattern, even the Inside Bar pattern. Traders typically place their stop-loss orders somewhat beyond the opposite end of the Inside Bar range to compensate for potential market noise and false breakouts. More especially:
- Put your stop loss order slightly below the range of the lower end of the inner bar to begin a bullish trade.
- Position the stop loss for a bearish trade. Just above the upper limit of the Inside Bar’s range
- If a trade doesn’t go as planned, traders can protect themselves from adverse market movements by setting a stop loss.
Get The Most Out Of Your Inside Bar Setup
Traders frequently use take-profit methods to benefit from positive market movements, although predicting the possible move with Inside Bar breakouts can be tricky. Here are two such methods:
Trailing Stop
Traders can protect their gains and have more space for profit by using a trailing stop after prices have moved in their favor. If the price keeps going in the right direction, this dynamic stop-loss order will change to reflect that.
Set Goal For Take Profit
Predicting when to get out of a trade is as easy as setting a take-profit target at a certain reward-to-risk ratio (say, 1.5:1 or 2:1). The minimum objective would be situated 120 pips away if the stop loss, for example, is 80 pips from the entrance. Traders can adjust to changing market conditions and effectively control profits by combining various take-profit tactics.
Breakout Within The Day
On The Daily Chart, There Is A Higher Probability
Applying the Inside Day Breakout method to the daily chart yields far better and more consistent results. The complete trading day is captured by the daily timeframe, which offers a thorough picture of price action. By excluding intraday noise and swings, this lengthier timeframe provides a more accurate picture of market sentiment and patterns. On the daily chart, the Inside Day Breakout becomes even more important since it shows all the trading activity that happened during the day. This gives traders a better picture of the market as a whole, which helps them make better judgments.
Pattern Of The Day On A Daily Basis
Many people call the Inside Day pattern, when seen on a daily period, an Inside Day Breakout. The creation of an Inside Bar, in which the current day’s high and low are entirely contained within the previous day’s high and low, is a hallmark of this pattern. A temporary consolidation of market dynamics and a reduction in volatility are both hinted at by the Inside Day.
Reliability Due To Full Day Of Trading Activity
The entire trading day is contained within the Inside Day Breakout pattern, which is why the method is so reliable on the daily chart. Because the data is comprehensive, traders may evaluate the market’s performance over the course of a trading session, providing details on the session’s highs, lows, and closing prices. The consistency of the Inside Day pattern is based on the fact that it captures the overall emotion and decisions made by market participants throughout the day. A common perception among traders is that the Inside Day Breakout heralds a period of uncertainty before the market could see a sudden upswing. Whether the breakout is bullish or bearish, it indicates that the market has finally made up its mind and might mark the start of a new trend or its continuance.
ID NR4: Inside Day Breakout With Narrow Range
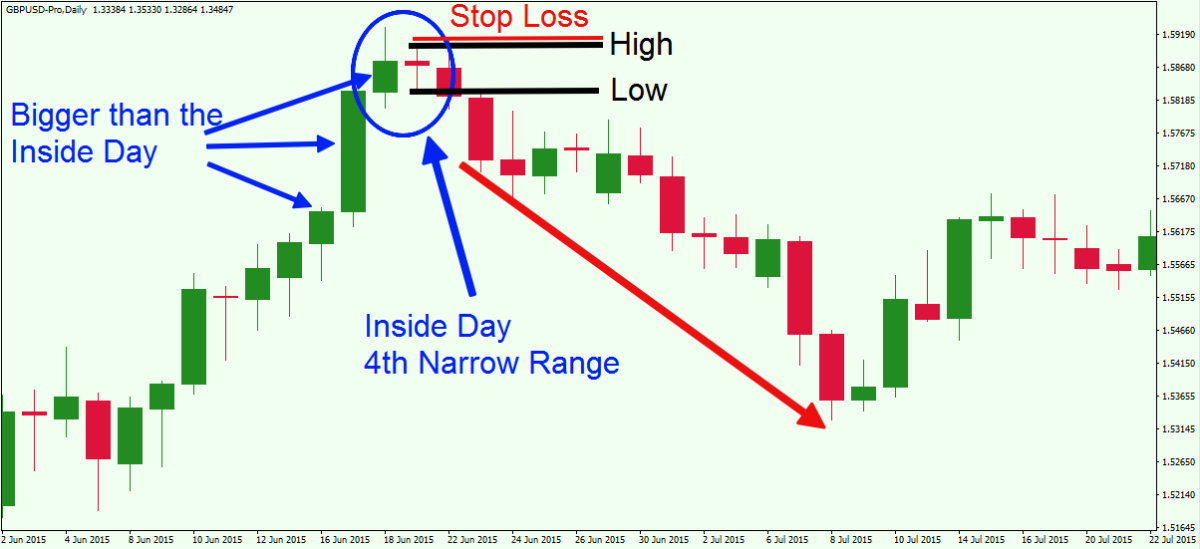
Verification Of The Last Four Days’ Inside Days/Narrow Range (ID NR4)
One variant that incorporates the Inside Day pattern with the tightest range of the past four days is the Inside Day Breakout with Narrow Range (ID NR4) pattern. To confirm the ID NR4 pattern, find an Inside Day where the range of the previous four days completely contains the high and low, and where the range of the Inside Day is the smallest of those four days. Less volatility is indicative of an impending breakout in this pattern.
Pattern Details And How To Enter The Market
Notable features of the ID NR4 pattern encompass
Inside Day Formation
When the formation of an inside day occurs, it suggests that price volatility will diminish and that there will be a short consolidation period.
Reduced Price Volatility
The Inside Day’s range should be the tightest of the last four days to highlight the reduced price volatility.
Breakout Anticipation
The decreased volatility that follows the ID NR4 pattern is generally seen by traders as a harbinger to possible large price swings, leading them to predict a breakout. Typically, to enter a trade using the ID NR4 pattern, one must wait for the price to break out of the range set by the Inside Day. When the price breaks above the high of the Inside Day, bullish traders may think about going long, and when the price breaks below the low of the Inside Day, bearish traders may think about going short.
A Daily Chart For Trading The GBP/USD
As an example, in order to spot an ID NR4 pattern on the GBP/USD daily chart, one must look for an Inside Day, defined as the day with the tightest range relative to the preceding four days. Following this, traders can sit tight for a breakout, at which point they can either go long (if the price reaches or exceeds the Inside Day high) or short (if the price falls below the Inside Day low). With this method, investors might profit from possible large price swings after a period of low volatility.
Hikkake Pattern
Failure Of The Inside Bar Pattern
A striking departure from the typical Inside Bar pattern’s success is the Hikkake pattern. The Hikkake pattern indicates a fakeout or failure rather than a sustained breakout towards the original Inside Bar. This breakdown happens when the market soon after the breakout starts to move in the other direction, breaking the range of the Inside Bar. When traders see a Hikkake pattern, they may decide to reposition their positions in anticipation of a possible reversal in the market.
Hikkake Pattern Recognition
Here are the main steps for traders to spot the Hikkake pattern
Breakout From Inside The Bar
This pattern starts with the establishment of an inside bar and a breakout towards it. The continuation of the trend produced by the Inside Bar may be believed by traders due to this breakout.
Swift Reversal
One of the most distinctive features of a Hikkake pattern is the quick reversal that happens within the following two or three bars. Market mood has shifted, and the first breakout failed, as the reverse breaks through the other end of the Inside Bar range.
Confirmation Of Failure
When the market makes a clear reversal of its initial breakout, suggesting a possible change in the overall trend, traders wait for confirmation of failure.
Turning Around Following Confirmation Of Hikkake Pattern
If traders see the Hikkake pattern and then it’s confirmed that the deal has failed, they might think about turning around. Trading in the opposite direction of the reversal signifies ending the trade that was in line with the first Inside Bar breakout. As an example:
Initial Long Trade
For starters, if the first Inside Bar breakout was upwards, traders who were long could want to think about getting short instead.
Initial Short Trade
On the flip side, traders who initially went short may think about getting back into long trades if the original breakout of the Inside Bar was to the downside.
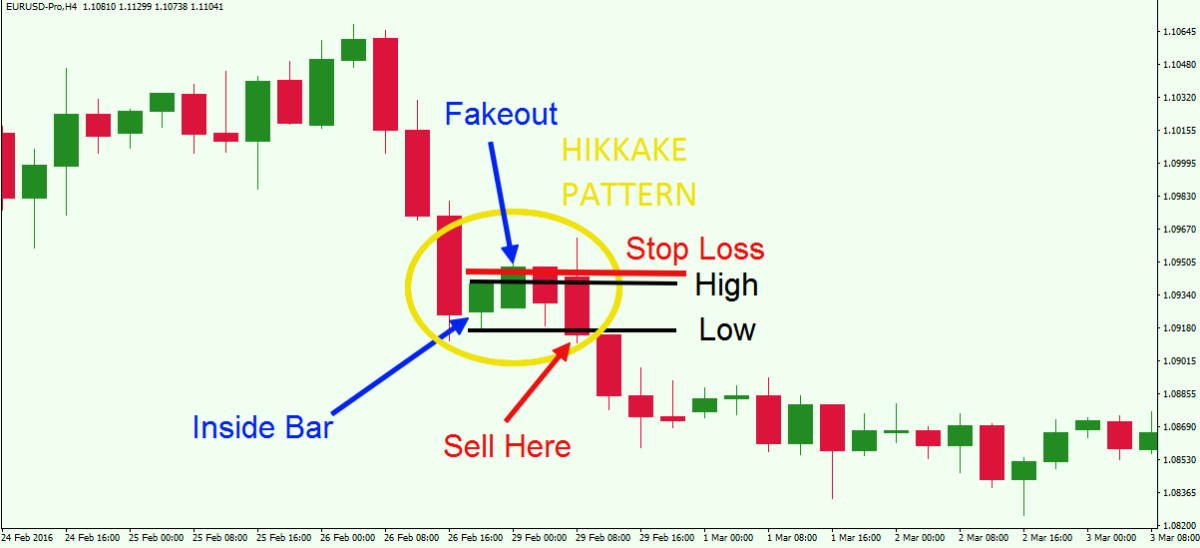
A Real-Life EUR/USD H4 Chart Trading Example
Using the EUR/USD H4 chart as an example, let’s pretend the following
Formation Of Inside Bar
An inside bar has formed, which may indicate that the current trend will continue.
Initial Breakout To The Upside
When the market first starts to rise, it encourages traders to think that the uptrend will continue.
Hikkake Pattern Confirmation
The following two or three bars will see the market do a sharp U-turn, confirming the Hikkake pattern by breaching below the range of the inside bars.
Position Reversal
Traders that notice the Hikkake pattern may decide to establish short positions in line with the verified reversal or close their long holdings, whichever comes first. As market conditions change, traders can adjust by understanding the mechanics of the Hikkake pattern. This knowledge helps them capitalize on chances that arise from quick reversals, avoid losses from false breakouts, and adapt to new market conditions. In order to successfully navigate the intricacies of price action, it stresses the significance of being responsive and flexible.
Conclusion
Traders can read market mood and possible trend changes by mastering the Inside Bar candlestick breakout technique. A comprehensive trading strategy includes the detection of Inside Bar patterns, analysis of certain traits, and use of strategic entry, stop-loss, and take-profit methods. Traders who are well-versed in Inside Bar methods are able to adapt to different market situations, whether it’s identifying Inside Day Breakouts, adding Narrow Range patterns, or navigating Hikkake pattern failures. Traders can improve their capacity to make educated and lucrative trading decisions by integrating these insights with a methodical approach to risk management.
Frequently Asked Questions
1. When Trading, How Important Is The Inside Bar Pattern?
Trading significance lies in the fact that the Inside Bar pattern suggests a moment of market consolidation or hesitation before to a possible breakout, reversal, or continuance. In order to profit from future price changes, traders look for this pattern.
2. What Does An Inside Bar Pattern Seem Like To A Trader?
The first step in spotting an inside bar is to establish the current trend with the use of technical indicators or price action research. The second is to find a candlestick that is entirely enveloped by the high and low of the previous candle.
3. What Makes The Morning Hours The Best For Inside Bar Research?
For Inside Bar analysis, the daily timeframe is ideal since it removes short-term fluctuations and gives a more true picture of how the market is feeling. It improves the reliability of identifying Inside Bars, which in turn produces stronger trading signals.
4. How Does The Pattern’s Efficacy Depend On The Size Of The Inside Bar?
The size difference between the Mother Bar and the Inside Bar is crucial. There is less volatility and a better chance of accurate signals when the Inside Bar is smaller than the Mother Bar. The ideal location for the Inside Bar to take shape is either halfway up or halfway down the Mother Bar.
5. In Inside Bar Trading, How Does One Deal With Risk?
Inside Bar traders control their exposure to loss by setting stop-loss orders well beyond the range of possible Inside Bar prices. In order to maximize profits while minimizing losses, they also use take-profit tactics like set targets or trailing stops.